Implementing the
Redland Genstar Data Mart
by Anissa Stevens, AVANCO International, Inc.
Data Marts, departmental versions of a Data Warehouse, have increased in popularity as corporate America has come to realize that they serve as low cost analysis tools for improving specific corporate business processes. Oracle's Data Mart Suite is a non-complex bundling of software products which includes Oracle Enterprise Server 7.3, Oracle Designer, Oracle Data Mart Builder, Discoverer 3.0 and Oracle Web Server. It is designed to provide all the tools needed to easily implement a data mart on the Windows NT platform. Avanco participated in the development and deployment of the first Data Mart Suite sold by Oracle Corporation and we have a unique insight into the best methods for deploying an Oracle Data Mart.
This case study begins with a discussion of data marts in a decision support analysis environment and some reasons why data marts are so popular. This technical discussion will center on data mart theory, architecture, and a design methodology which will lay the groundwork for a discussion of specific methods for developing a data mart using each of the Oracle Data Mart Suite tools. The context for this "How To" discussion will be lessons learned in the actual design, development, and deployment of the first Oracle Data Mart Suite at Redland Genstar.
Data Mart Overview
A data mart is a simpler form of a data warehouse focused on a single subject (or functional area) such as sales, finance, or marketing. Data marts are not differentiated from data warehouses based on size, but on use and management. However, data marts are typically smaller and less complex than data warehouses and therefore are typically easier to build and maintain. Data marts can be built as a "proof of concept" step toward the creation of an enterprise-wide warehouse. A data mart can be built in a 3-6 month time frame where a data warehouse will take from 2-3 years to complete.
The fundamental tasks in data mart development are designing, feeding, storing, accessing, and managing the data environment. Using the components of the Oracle Data Mart Suite, each tool is used as appropriate to perform the steps in the process to build a data mart.
Redland Genstar Background
We deployed the first Oracle Data Mart Suite at Redland Genstar. In business for more than 80 years, Redland Genstar Inc., of Towson, Maryland, is one of the oldest stone, blacktop, and concrete companies in the United States. Genstar has been undergoing a transition since 1999, moving its financial systems from an IBM ES/9000 mainframe to an IBM AS/400 client/server environment. To help its sales and marketing representatives analyze the customer base of construction and pavement companies and to eventually assess the efficiency of its distribution network, Genstar is building a data mart that pulls data from the ES/9000 and AS/400 systems and integrates it, utilizing Oracle Data Mart Suite for Windows NT.
Genstar's goal in building the data mart was to provide graphical ad hoc access to information without involving IT every time someone requires a report.
Steps in Building a Data Mart
We followed a series of steps in the design, build and implementation of the Genstar data mart to ensure successful deployment.
1. Identify Business Drivers
Before implementing any Data Mart, it is imperative to have a strong business driver for the project. A business driver answers the questions, what is the business need and Return on Investment (ROI) that fuels the need for the effort?
In Genstar's case, they had a short window to get reports on an as-needed basis to check their profitability status. The old process of running reports from the AS/400 machine took approximately one week. The Data Mart reduced this time tremendously and allowed for quicker analysis and improved decision support within the enterprise.
"The data mart will enable us to analyze trends and to ask a variety of questions we haven't been able to ask very well," Claudia Serfass, Genstar's manager of Information Technology said recently. "These are simple but important questions such as 'Who are we selling to? In what volumes? Where are our customers located? And when do they buy?' When we find out who our best customers are or where we're lacking, we'll use the information to expand that market. We also want to know if we're distributing our goods as efficiently as possible. Loading distribution data into the data mart will give us those answers."
2. Identify Sponsorship
Data marts in general require approval at a much lower level of the corporate sponsorship chain than a Data Warehouse, for example at the manager level. Data Warehouses require a very high level of sponsorship, usually CEO and/or board level. On the other hand, the higher the sponsorship level is for a data mart, the more likely the project will become successful.
Genstar had a highly committed sponsor to the project, the divisional manager for Redland both in San Antonio and Maryland. There was a lot of interest in having this project up and running in short time. It is important to make sure the sponsor has influence over the organization. The idea is for their testimony for the data mart to carry weight and therefore keep the interest going, and the resources committed.
3. Conduct Readiness Assessment/Site Check
In order to have a working knowledge of the systems, data, and people who will be working on the data mart, it is essential to spend the time up front completing a readiness assessment. It is important to have people on the design team who understand the source system. At Genstar, it was necessary to have someone who understood the billing system, so we could understand the calculations going into the data mart, and why.
Establish the type of business that the data mart will deal with, the size of the budget, the level of urgency to get the product up and running and the size of the user group community. Who is going to use the product? Without understanding the targeted business environment, fulfilling user requirements becomes difficult at best. It is essential to establish the working environment and server type that the Data Mart Suite will be loaded on. The server should be robust enough to handle the Data Mart Suite.
In Genstar's case, they had purchased a server, a Compaq Proliant 6000 server, with 256Mb of RAM, and a single 200Mhz processor, with the capability of upgrading to four. There were four 4.3GB SCSI hard drives, which were striped for load balancing. It was more than sufficient for the initial stages of the data mart, and their initial database of 1 1/2 years worth of data. Genstar has current plans to add three more processors and double the hard drive space as more data is added.
4. Survey User Needs
The next vital step in creating a data mart, before the design phase, is to answer some basic questions concerning the customer that will drive your design. Since a data mart is based on a single subject area, it is important to clearly define a subject that is measurable.
For instance Genstar identified profitability as their primary subject area. There were very discrete measures for this report, such as revenue, total cost, and item quantity. The subject area needed to be clear from the beginning. If it is not apparent from the start, find out from the customer what types of reports they would like to see, or are currently trying to see. From these answers, the subject area can be finalized. In our case, we found that having the client choose a series of reports which they had never been able to produce on the AS/400 resulted in immediate client interest for the project and greater cooperation for the prototype.
In working with the subject area, find the level of informational detail the customer will want to see on the reports. Focusing on the degree of data granularity will have an impact on the design of the fact table. Genstar wanted to add a lot of detail to their fact table, which could have caused a lot of overhead if numbers were not used realistically. It is important to get from the customer what they NEED to see in their reports, not what they WANT to see. It may be hard to differentiate between the two, but it is a necessary step. It is very easy to add as much detail as possible, because the client will see it as an open opportunity to get to all of the data. In reality they will not use the majority of the information and the subject area will be poorly focused.
The immediate obstacle, as with any Data Mart, was the process of learning Genstar's business model to the degree that we could understand the calculations going into the system. Their older billing system did not make calculations for profitability, but had all of the calculations necessary to get to profitability. We designed the tables so that profitability would be pre-calculated and stored in the fact table, to avoid calculations on the fly in the Discoverer browser, which could slow down queries. These calculations were an ongoing learning process. It is not necessary to know everything about the business to procede with the project. It is necessary to have someone available on the project that can answer business related questions quickly and has the authority to do so.
It is also important to find out what the required business dimensions are for the reports. For instance, Genstar gave our team a prototype report of profitability by customer and by product line which included Concrete, Blacktop and other manufactured products. The dimensions derived from these specs determined the level of detail in the star schema.
It is also necessary to determine from the customer the length of time they would like to have data stored in the initial database. Will the Data Mart store one year of data or many? The time dimension is a vital piece in the star schema.
The answers to all of these questions will allow for a much more focused data mart design that the end users will be able to get answers from quickly and without frustration. It is also necessary to determine the source systems from which the final data mart will be populated. Genstar downloaded files from the AS/400 machine to comma delimited flat files for load into the Oracle database.
5. Install Oracle Data Mart Suite
The Data Mart Suite installation is very straightforward. It installs the data mart database, DMDB, as well as the enterprise manager database, EMDB. It sizes and tunes the database to a sample size data mart, which should be customized to the specific environment. It does not install the Data Mart Designer product by default and must be installed during a custom install.
The following is a list of the sample tablespaces after the installation:
Tablespace_Name
ROLLBACK
SYSTEM
TEMP
USERDATA
It is a good idea to add another rollback segment tablespace for large transactions during the load process. Since this is not an OLTP database, large rollback segments are not needed during production, just during the monthly download procedure. In order to perform the initial load, it is extremely important to have this rollback segment available. The USERDATA tablespace can be used for the data that will be loaded into the data mart, but it is probably better to create another data tablespace that will hold all of the target data, and an index tablespace for all of the indexes on the data. Make the temporary tablespace size about one half the size of the data tablespace, since there will be a lot of sorting and querying of tables.
6. Design Target System for Data Mart
Once all of the information is gathered, it is time to start designing the target database. Use the Data Mart Designer to create the target database. The Data Mart Designer is a scaled down version of the Designer/2000 Oracle product. The Data Diagrammer (Fig. 1) within the Designer tool will allow the creation and definition of entities.

Figure 1. Data Mart Diagrammer (click to enlarge)
The central focus of the data mart is the star schema. The star schema consists of a main fact detail table with dimension tables branched off of the fact table. The detailed fact table contains a key to each dimension table as well as any metrics used to quantify the subject area, such as profitability was for Genstar. The dimension tables hold the key to the fact table and any information regarding the particular dimension. The Data Mart Designer will create the DDL necessary to create the tables as well as the constraints on the tables.
Instead of using the direct codes from the dimension table, we recommend using a synthetic key as both the primary key to the dimension table, and the foreign key to the fact table. The key can be generated via the Oracle Data Mart Builder. The size in bytes of the synthetic keys as compared to the actual OLTP keys can be significantly smaller and more efficient if there is a lot of data in the fact table. It is also important to use the synthetic keys in order to keep uniqueness on data that is brought into the target system. It is essential to understand the data that is being migrated and to ensure that duplicate information is not stored uniquely in the fact table. Remember, this is a very "data driven" process.
The Genstar fact table was built from tickets and invoices of stone products, etc. that were both purchased and hauled to a certain site. Fields in that fact table included a key to each dimension, as well as calculations for that ticket, such as item cost, freight cost, total cost, revenue, profit, and item quantity. The dimension tables included a customer table, product table, plant table, hauler table, sales rep table, delivery zone table and a time dimension table. For example, the customer table contained a customer key, customer code, customer name and customer type field. As you can see (Fig. 2), the customer code and name are in the same table, in a denormalized fashion to avoid branching out to another table containing simply a customer code and customer name. The key to each of the dimension tables is in the main fact table, Ticket_Invoice, as well as the measurable fields for profitability.
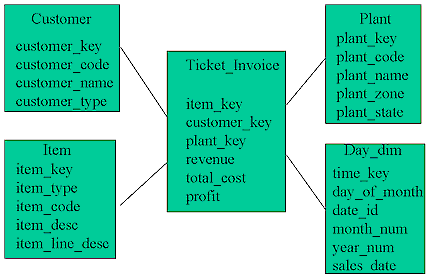
Figure 2. Sample Star Schema
The time dimension is a vital piece in the star schema. The key is usually a Julian date field that is based on a date in the main fact table. The Data Mart Builder (Fig. 3) will create and load the time dimension table, which creates the Julian date id that will represent every day of a year for the amount of time specified in the creation of the time table. As you can see we chose the start date to be January 1, 1993 and the amount of days to be 1461, which is the equivalent of 4 years plus one day for a leap year.

Figure 3. Data Mart Builder Time Generation Transform (click to enlarge)
The table will automatically be created and populated in the schema. In the main fact table it was necessary to make a particular date the field to drill down in order to get information. We used the invoice date in the Oracle date format as the drill down field for information in the fact table. We had to create a date_id field in the fact table, which was the key to the dimension table, and populate that field with the Julian date of the invoice date field. This allowed for any information grouped by that particular invoice date to be drilled down to using the time dimension link.
7. Data Mapping, Extraction, Transformation and Scrubbing
Once the star schema is designed, it is time to load the target system. Oracle�s Data Mart Builder is used for this process. Within the tool, create a baseview, a pictorial look at the database tables, for the target system. It is also possible to create a baseview for the source system if the data is loading from another database, either from an Oracle database or any other database management system. Other relational databases connect either natively or by using an ODBC driver.
With the Data Mart Builder, several functions are performed with the data before it is actually loaded into the target database. Genstar exported their AS/400 data down to a flat file, comma delimited, separated by double quotes. To load this data from the builder, we navigate to the transform window and choose the CSV(comma separated variable) Source transform by dragging it into the top right hand of the screen. Double click on the CSV transform and type in the datafile name of the flat file. It is important to remember that when creating flat files, the first line in the file must correspond to the columns of the table to be loaded. It is possible to load one flat file to several database tables. It is also possible at this time to do any cleansing of the data. By using the search and replace transform it is possible to transpose some of the data that is coming in from the flat file. Dragging the grid transform over and clicking the update button allows the user to see what the data will look like when it is loaded before it actually goes into the database. Once the data is correct, the SQL*Loader transform is added to replace the view Grid. It is also an option to use the Batch Loader transform, but the SQL*Loader handles larger amounts of data more rapidly by using the direct path loader as unrecoverable. If that option is used, make sure a bad file and a log file location are put in the properties of that transform. Also at the same time the data is loading from the flat file, it is possible to generate the synthetic keys with the key generation transform. Figure 4 demonstrates the search and replace transform and the key generation transform of the customer table, which automatically generates the synthetic key, cust_key. It is also possible to load the table through the CSV transform. Once the star schema is populated, it is time to build aggregations.

Figure 4. Data Mart Builder With Transforms (click to enlarge)
8. Build Aggregation
Summary tables are a very important consideration for data mart design. Summary tables are built in order to reduce the amount of processing time to gather data that is frequently used from the detailed fact table. For example, Genstar has a fact table of about 1.5 million records. They frequently gather and execute reports by month, quarter and year. Instead of running a particular query from the main fact table to produce a report that took approximately 8 minutes to run, we built a monthly summary table and the query executed in 30 seconds. The number of records in the monthly summary table was 200000, much smaller than the 1.5 million records in the main fact table. The yearly table had approximately 140000 records. The basic idea behind building the summary table in our case was to gather data off of the main detailed fact table, and roll it up to a month level, a quarter level and a year level. Be sure to have the summaries built only from the detail fact table and dimension tables. Never build an aggregation or summary that contains data from a source that is not represented in the data mart system fact and dimension tables.
There are several methods which can be used to build the summary tables, either with the Discoverer tool or independently from the Discoverer tool. Both require you to register them in the tool for query purposes. The Genstar aggregate tables were created outside of the Discoverer tool, and registered within. This allowed for greater flexibility in the download procedure as well as the naming conventions of the tables.
9. Build Oracle Discoverer End User Layer
Once all of the Data Mart tables are built and registered, it is time to work with the Discoverer Administration product and create the End User Layer. The end user layer will be customized to fit the types of reports that the customer needs to see. Change the names of the columns so that they are more user friendly, as well as create drill down relationships on columns, such as date fields, and region to city. The purpose of the end user layer is to make running reports as painless to the user as possible, without a large learning curve. See Discoverer 4.1 - Strategies for Proactive End User Layer Administration for more information about creating a Discoverer EUL.
10. Create Discoverer Workbooks For Users
If there are users who have not used the Discoverer product before and are not familiar with creating workbooks, it is a good idea to create workbooks and have users run them, instead of having them create the reports from scratch.
With Genstar, managers wanted to run profitability reports by month/year/quarter. We created several workbooks for monthly profitability with sheets in the workbook corresponding to a particular month. That way, users of the Decision Support System could run one workbook and view each corresponding sheet in order to do a comparison by months. We did the same thing for year and for quarter. This also allowed quicker analysis of data for the end users, which in this case were sales staff and managers trying to meet their sales quota numbers for the year. They did not have to spend the time creating the workbooks themselves. End users could also edit the workbooks if they chose and save them on their own machine or in the database to get more or less detail in their reports and personalize the reports for their own needs.
11. Create Recurring Download Procedures
As a last development step, we scheduled download procedures for source to target data loads. It is essential to decide the frequency of downloads for the data mart. At Genstar, we implemented a monthly download procedure. There were a lot of factors to consider with implementing this download. Genstar wants one executable that kicks off monthly in a batch mode, without any user intervention. We created an executable within Visual Fox Pro. Our first step in this procedure was to download to a CSV file from Visual Fox Pro 5.0, separated by commas and delimited by a �|�.
For the load, we opted not to use the Data Mart Builder for several reasons. First of all, the Builder was having trouble processing the key lookup transform. The client at Genstar had more familiarity with FoxPro and had a number of transforms already built in a particular FoxPro application. This ended up being our source for Staging Table data. The second reason was because we were loading item descriptions from an item table that had many items that contained a double quote,", which was standing for inches, such as �" ST. The builder required the file to be separated by commas, delimited with the ". When it was separated with the double quotes, it was loading incorrectly, so we had to use SQL*Loader for that particular file as well as the remainder of the files, using the | as the delimiter. The files get loaded into temporary tables, and then through scripts were added to the owner of the star schema.
Within the executable, we kicked off a series of PL/SQL procedures that read from the temporary tables and checked the live tables for duplicates. If a record existed, the procedure updated the live tables, and deleted that record from the temporary tables. If the record did not exist, it added the record to the live table, and increased the synthetic key by one.
For the main ticket table (fact table), we had a staging area table with both the dimension table codes as well as fields for the synthetic keys. Since the keys were not coming down from the flat files we were required to populate these keys on the main table. This process was the Oracle Data Mart Builder key lookup transform. We ran scripts that performed key lookups from the main tables and inserted them into the temporary main ticket table that served as a staging area. After the keys were all generated for each dimension, we inserted the data into the live ticket table directly. The procedure then truncated and droped the summary tables and rebuilt them from the main fact table. After the summary tables were built, the procedure exported the data and automatically rebuilt the rollback segments that were fragmented by the load.
At this point, it is a good idea to size the tables for years of future growth. This can be done earlier in the process, but with a completed download, it is possible to see the amount of data coming down in a given month, and plan accordingly. It is a good idea to rebuild the database according to how much data that is being loaded. With Genstar, we gave plenty of room for growth, because they had the room on their drives for it. Be sure to resize indexes, tablespaces, and rollback segments.
12. Test/Train/Deploy/Monitor
At this point, it is time to put the data mart to the test. Before releasing the product to the users, fully test the entire system in order to discover any hidden reporting errors or performance problems before rolling the system out to users. It is best to have the people who are anxious to use the product be the first selection for training. User education, input, and hands-on experience are the best advertisements within the organization. Do not let the users access the data prior to training, it can lead to frustration as well as "bad press" if they are not familiar with the tools. Once the users get hands on with the product and start to see some positive results, word of mouth will spread on the product, and interest will be generated. Monitor the product, as well as users reactions as the product is rolled out. The most important thing to watch is the download procedure and how it affects the system as far as space and performance.
As a final step at Genstar, we gave a training session to some of the sales managers, and they were very excited about the product. "Our users have never seen anything this responsive," said CIO Claudia Serfass. "I think it will make a dramatic change for them in the way they look at our business. They'll be able to query the data quickly and easily, and the graphical tools will let them see enterprise information any way they want. Real-time, interactive access will be a big change in the way our company looks at our information."
Conclusion
The Data Mart Suite is a low cost bundling of Oracle tools which when used properly leads to a successful Data Mart roll-out. We found that, as in almost any early release of a product, there were a number of workarounds required and issues which needed resolution internally and with Oracle support with this particular project. By the year 2000, the Data Mart Suite had certainly come of age and does not require the workarounds needed when we worked on the Genstar project which was the first Data Mart Suite deployment performed by any company inside or outside of Oracle. The Data Mart Suite is a powerful design and build product suite which has great promise for the future.
About Anissa Stevens
Anissa Stevens is the Director of Technical Consulting Services and a Certified Oracle DBA. She has been with Avanco for over 7 years and serves as the senior technical resource for Avanco. Anissa is lead consultant and architect for all Oracle projects. She also provides high level DBA support to customers. A 1989 graduate of Towson State University and active volunteer for the Mid-Atlantic Association of Oracle Professionals (MAOP), she has served NASA and many commercial clients as a DBA, Oracle software analyst, data warehouse specialist and task leader, designing and developing large scale database management and decision support systems. Anissa has designed and implemented both small and large Data Warehouse systems for commercial and government clients. Anissa has been a technical reviewer for Oracle Press as well as contributed to the Oracle Security Handbook and the Oracle 9iAS Application Portal Handbook both by Oracle Press.
About Avanco
Avanco International, Inc. is a software consulting company specializing in business intelligence, data warehousing, business process improvement, relational data base design and Web-based Portal application development. As an Oracle Premier Solution Partner, Avanco has a staff of certified consultants to assist clients in developing solutions that streamline business practices through innovation and automation. The Web URL is www.avanco.com.
From the Editor: Some Questions for Further Analysis and Discussion
- What is the purpose of a Data Mart? How does a Data Mart differ from a Data Warehouse?
- Is this a data-driven Decision Support System? Why or why not?
- What is a fact table? What is a star schema?
- What technologies were used?
- What is the major benefit of using a data mart rather than a data warehouse for providing analytical information to decision makers? Why?
- What problems or difficulties do you anticipate with the use of this type of decision support solution?
Please cite as:
Anissa Stevens, "Implementing the Redland Genstar Data Mart", July 2, 2004, at URL DSSResources.COM.
The data mart project at Redland Genstar was completed in 1999. Anissa Stevens provided permission to use this case study and screen shots at DSSResources.COM on June 11, 2004. Contact her at email anissa@avanco.com. This case study was posted at DSSResources.COM on Friday, July 2, 2004.
This case study is provided for informational purposes only. DSSResources.COM makes no warranties, express or implied, about this case summary.